Bone Mineral Density and Fracture
The project used the dataset from Kaggle https://www.kaggle.com/datasets/jehanbhathena/bone-mineral-density
The objective:
The objective of this project was to analyze a dataset on bone mineral density and fracture. The study aimed to investigate several key aspects. Firstly, the project examined the difference in bone mineral density between males and females. Normality tests, including graphical analysis, the Shapiro-Wilk test, and the ad.test, were conducted to assess the distribution of the data. Subsequently, a t-test was employed to compare the bone mineral density values between the two gender groups. Furthermore, the project explored the relationship between age and bone mineral density by utilizing a linear model. This analysis sought to understand how age influences bone mineral density. Additionally, a prediction model was developed to estimate bone mineral density based on age. Finally, a logistic model was used to determine the impact of bone mineral density on the occurrence of fractures. Through these steps, the project sought to gain insights into the association between bone mineral density, gender, age, and fractures.
Evaluating the difference in bone mineral density between males and females:
Tested the normal distribution using graphs, the Shapiro-Wilk test, and ad.test.
Conducted a t-test to compare the bone mineral density of males and females.
The graphs for group Males and Females look like a normal distribution.
Now we will use Shapiro.test to test for normal distribution to confirm the result from the graphs.
The p-value for the two groups is significantly large for males and females (p-values= 0.1876), indicating that the bone mineral density distributions in the two groups conform to the normal distribution assumption.
Test normal distribution with ad.test
Based on the p-value, we can restate that bone mineral density conforms to the normal distribution
Due to the conformity of the bone mineral distributions in the two groups to the assumption of normality,
The t-test can be used to compare the two groups.
Presenting the result:
T = 0: It represents the difference in means between the two groups (males and females) relative to the variability within the groups. Since the t-value is 0, it suggests that the means of the two groups are identical.
df = 336: The degrees of freedom for this test is 336
The p-value really large (p-value =1), so we fail to reject the null hypothesis. There is a no significant difference in bone mineral density between males and females.
Confidence Interval= 95% (from -0.03563498 to 0.03563498): provides a range of values within which we can be reasonably confident that the true difference in means lies.
2. Investigating the relationship between age and bone mineral density:
Utilized a linear model to examine how age affects bone mineral density.
Check linear model for age and bone mineral density
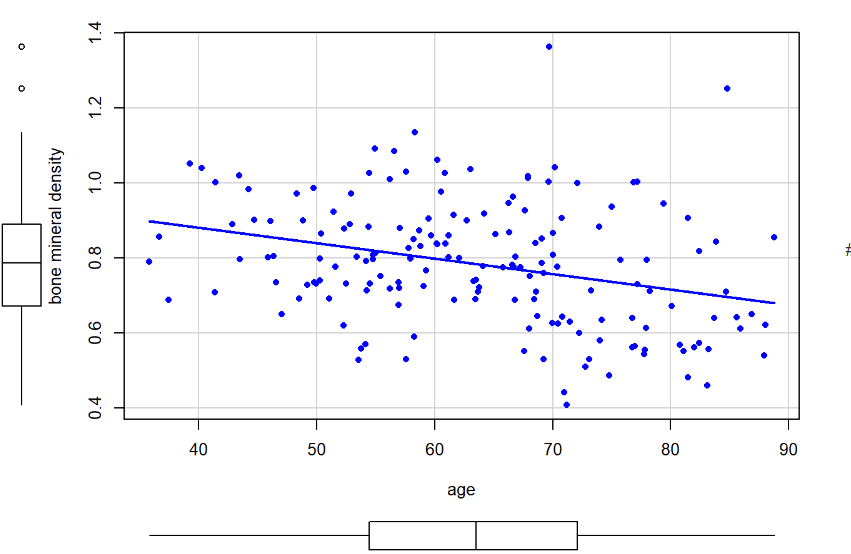
Scatter plot of age and BMD
We can estimate the bone mineral density for any age by the linear model:
y = 1.046 - 0.0041 * age
Fitting a linear regression model using the lm() function
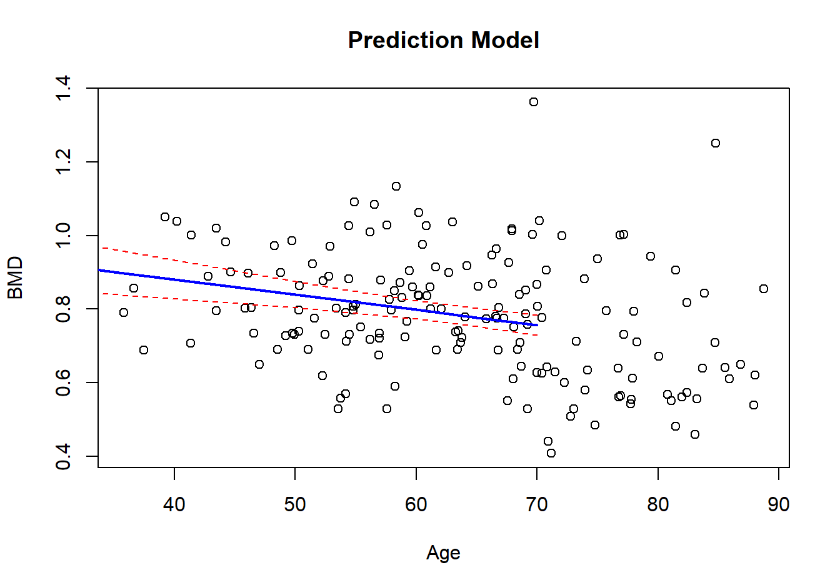
3. Developing a prediction model:
Built a model to predict bone mineral density based on age.
Presenting the result:
Residuals should be close to zero. The median, which is -0.001152, is not far from zero, indicating that the residuals are centered around zero. Additionally, the first quartile (25%) and third quartile (75%) quantiles are quite balanced around the median, suggesting a good fit of the model to the data.
t-test for beta is -4.162 and p-value = 0.0000504, so we have an evidence for a relationship between bone natural density and age
R-square = 0.08857, 8.8% the difference in bone natural density is explained by age
Conclusion: The analysis reveals a statistically significant relationship between bone mineral density (BMD) and age. However, it should be noted that the observed relationship is relatively weak in nature.
4. Exploring the influence of bone mineral density on fractures:
Evaluating the difference in BMD between fracture group and no fracture group
Employed a logistic model to determine the impact of bone mineral density on the occurrence of fractures.
The outcome shows that bone mineral density in fracture group is lower than that in no fracture group.
We have two independent groups, we can perform an independent sample t-test:
The t-test shows that the difference is statistical significance (p value < 2.2e-16)
Logistics model summary:
Conclusion: Intercept = 10.607 and BMD (beta) = -15.785. The beta coefficient indicates a negative relationship between bone mineral density and fracture risk, meaning that lower BMD levels are associated with a higher risk of fracture. z test with p-value = 2.59e -10, so the influence of BMD on fracture is statistically significant


